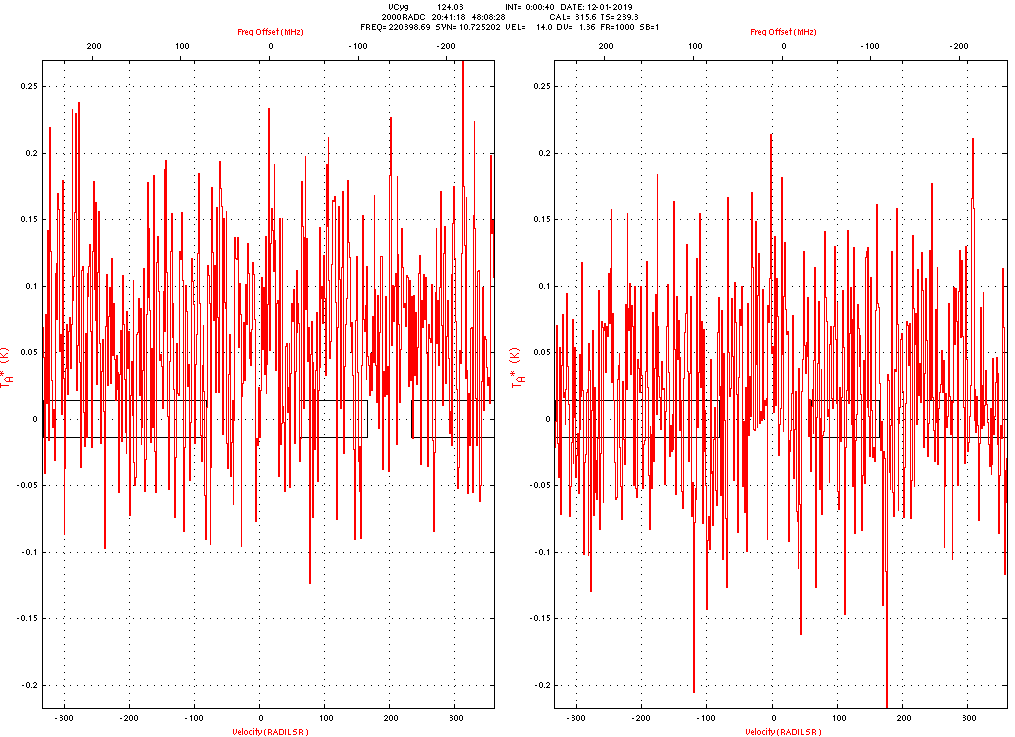
If the engineers plumb the same IF into two different backed sections and take data, it is possible to load these scans into Linuxpops and perform a Cross-Correlation on the data.
Now you can do a Cross Correlation on the two data arrays.
Linuxpops(
H0) >> xcorrelate
Linuxpops(
H0) >> # PD: Preparing Data
Linuxpops(
H0) >> # CM: Computing Pass: 1 Mean
Linuxpops(
H0) >> # CM: First-Pass: Mean-X = 0.061670, Mean-Y = 0.019247, 512 Good Channels
Linuxpops(
H0) >> # Removing any Channels 10X Mean: Pass 2
Linuxpops(
H0) >> # Flagging Y-Chan 157: Value: -0.205285: Factor: 10.67
Linuxpops(
H0) >> # Flagging Y-Chan 244: Value: 0.213948: Factor: 11.12
Linuxpops(
H0) >> # Flagging Y-Chan 375: Value: -0.217477: Factor: 11.30
Linuxpops(
H0) >> # Flagging Y-Chan 472: Value: 0.211250: Factor: 10.98
Linuxpops(
H0) >> # CM: Computing Pass: 2 Mean
Linuxpops(
H0) >> # CM: First-Pass: Mean-X = 0.061438, Mean-Y = 0.019394, 508 Good Channels
Linuxpops(
H0) >> # Removing any Channels 10X Mean: Pass 3
Linuxpops(
H0) >> # CM: Computing Pass: 3 Mean
Linuxpops(
H0) >> # CM: First-Pass: Mean-X = 0.061438, Mean-Y = 0.019394, 508 Good Channels
Linuxpops(
H0) >> # Converged on 3 tries
Linuxpops(
H0) >> # Now Remove any Channels 5X the
rmsLinuxpops(
H0) >> # Skipping Already Flagged Channel: 157, 0.120074 -0.205285
Linuxpops(
H0) >> # Skipping Already Flagged Channel: 244, 0.023823 0.213948
Linuxpops(
H0) >> # Skipping Already Flagged Channel: 375, 0.168449 -0.217477
Linuxpops(
H0) >> # Skipping Already Flagged Channel: 472, 0.051694 0.211250
Linuxpops(
H0) >> # Sorting 508 channels
Linuxpops(
H0) >> # Fitting linear regression using grace_fit()
Linuxpops(
H0) >> # Ignoring Results with vaules 1.5 times
rms: 0.075662
Linuxpops(
H0) >> # Copying
H0 to
H3Linuxpops(
H0) >> # Ignoring channel[ 41]:
data -0.129393 < -0.098282
Linuxpops(
H0) >> # Ignoring channel[ 256]:
data 0.181434 > 0.128818
Linuxpops(
H0) >> # Ignoring channel[ 38]:
data -0.103072 < -0.098082
Linuxpops(
H0) >> # Ignoring channel[ 328]:
data -0.146742 < -0.096542
Linuxpops(
H0) >> # Ignoring channel[ 64]:
data 0.157778 > 0.130651
Linuxpops(
H0) >> # Ignoring channel[ 260]:
data 0.132553 > 0.130979
Linuxpops(
H0) >> # Ignoring channel[ 508]:
data -0.116672 < -0.095947
Linuxpops(
H0) >> # Ignoring channel[ 426]:
data 0.177147 > 0.131430
Linuxpops(
H0) >> # Ignoring channel[ 248]:
data 0.136979 > 0.131815
Linuxpops(
H0) >> # Ignoring channel[ 223]:
data 0.170450 > 0.131920
Linuxpops(
H0) >> # Ignoring channel[ 440]:
data -0.097402 < -0.095041
Linuxpops(
H0) >> # Ignoring channel[ 449]:
data -0.105819 < -0.094987
Linuxpops(
H0) >> # Ignoring channel[ 331]:
data 0.141761 > 0.132268
Linuxpops(
H0) >> # Ignoring channel[ 194]:
data -0.126251 < -0.094405
Linuxpops(
H0) >> # Ignoring channel[ 33]:
data -0.101860 < -0.094335
Linuxpops(
H0) >> # Ignoring channel[ 364]:
data 0.160987 > 0.132778
Linuxpops(
H0) >> # Ignoring channel[ 175]:
data -0.097583 < -0.094152
Linuxpops(
H0) >> # Ignoring channel[ 164]:
data 0.154618 > 0.132928
Linuxpops(
H0) >> # Ignoring channel[ 275]:
data -0.112457 < -0.093935
Linuxpops(
H0) >> # Ignoring channel[ 82]:
data 0.154902 > 0.133270
Linuxpops(
H0) >> # Ignoring channel[ 374]:
data -0.114313 < -0.093663
Linuxpops(
H0) >> # Ignoring channel[ 473]:
data 0.158425 > 0.133351
Linuxpops(
H0) >> # Ignoring channel[ 135]:
data 0.163898 > 0.133399
Linuxpops(
H0) >> # Ignoring channel[ 386]:
data 0.158020 > 0.133493
Linuxpops(
H0) >> # Ignoring channel[ 471]:
data 0.165662 > 0.133674
Linuxpops(
H0) >> # Ignoring channel[ 227]:
data 0.148235 > 0.133710
Linuxpops(
H0) >> # Ignoring channel[ 278]:
data -0.161853 < -0.093203
Linuxpops(
H0) >> # Ignoring channel[ 196]:
data 0.166383 > 0.133868
Linuxpops(
H0) >> # Ignoring channel[ 370]:
data -0.139665 < -0.093068
Linuxpops(
H0) >> # Ignoring channel[ 404]:
data 0.137668 > 0.134037
Linuxpops(
H0) >> # Ignoring channel[ 295]:
data -0.126329 < -0.092845
Linuxpops(
H0) >> # Ignoring channel[ 217]:
data -0.099472 < -0.092618
Linuxpops(
H0) >> # Ignoring channel[ 172]:
data -0.143187 < -0.092214
Linuxpops(
H0) >> # Ignoring channel[ 116]:
data 0.184228 > 0.135618
Linuxpops(
H0) >> # Ignoring channel[ 305]:
data 0.141168 > 0.136091
Linuxpops(
H0) >> # Ignoring channel[ 190]:
data -0.105240 < -0.090404
Linuxpops(
H0) >> # Copying
H3 to
H0Linuxpops(
H0) >> # Wrote 472
data points
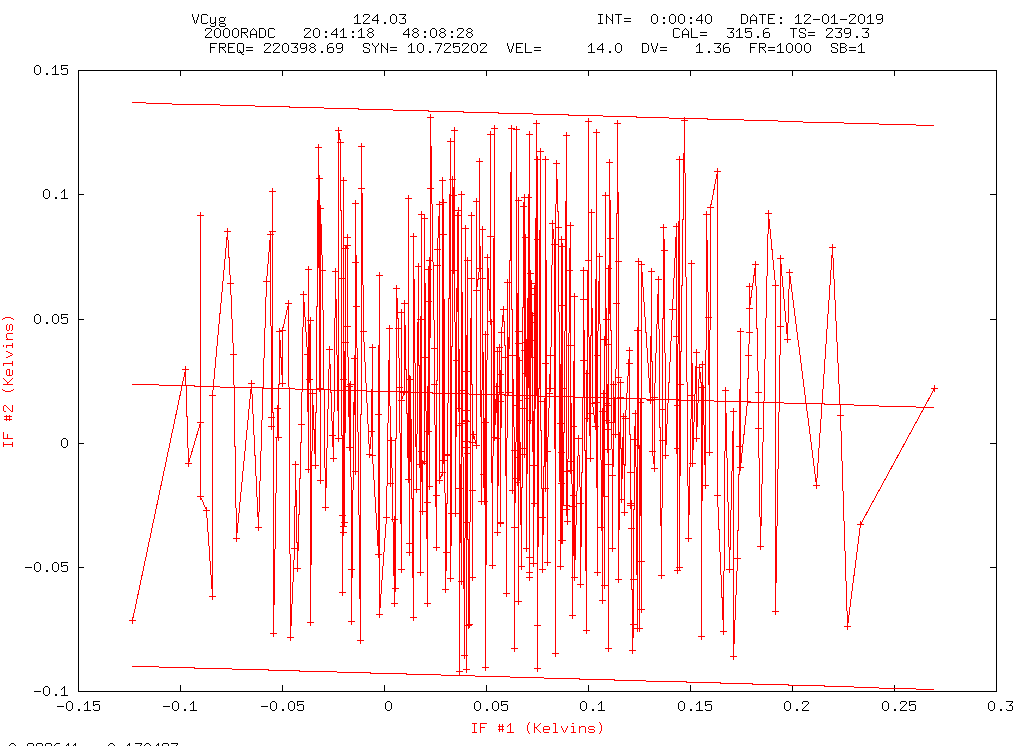
As can be seen, 472 out of 512 channels correlated and survived the rigorous criteria. The red bars are the linear fit of the data and +/- the rms. All data outside these limits was removed.
This is provided for illustrative purposes.
 1.8.5

